Dashboards
Create and share dashboards with your team
The Dashboard feature in NocoDB enables you to visualize data from your tables using charts, graphs, and metric widgets. Dashboards help present key insights to stakeholders through an interactive, configurable interface.
Getting Started
Creating a Dashboard
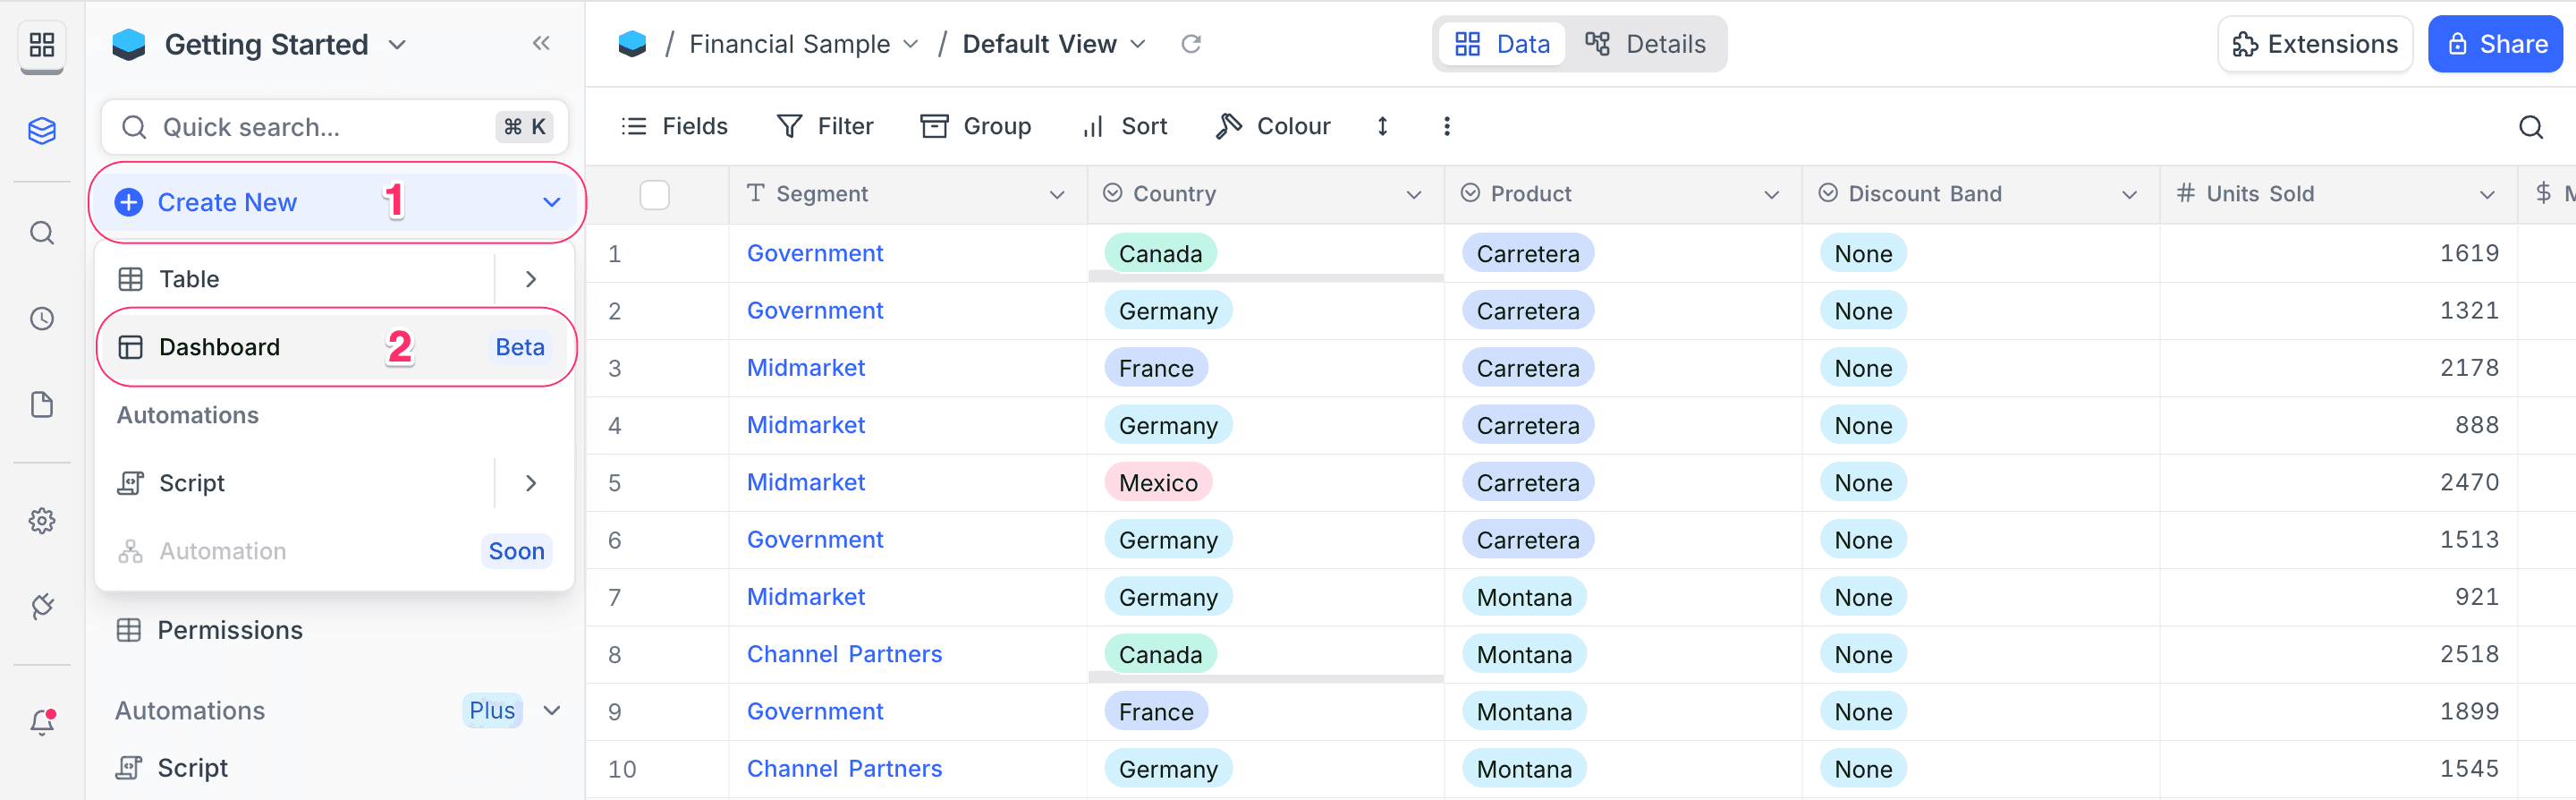
- Click on Create New in the left sidebar.
- Select Dashboard from the dropdown.
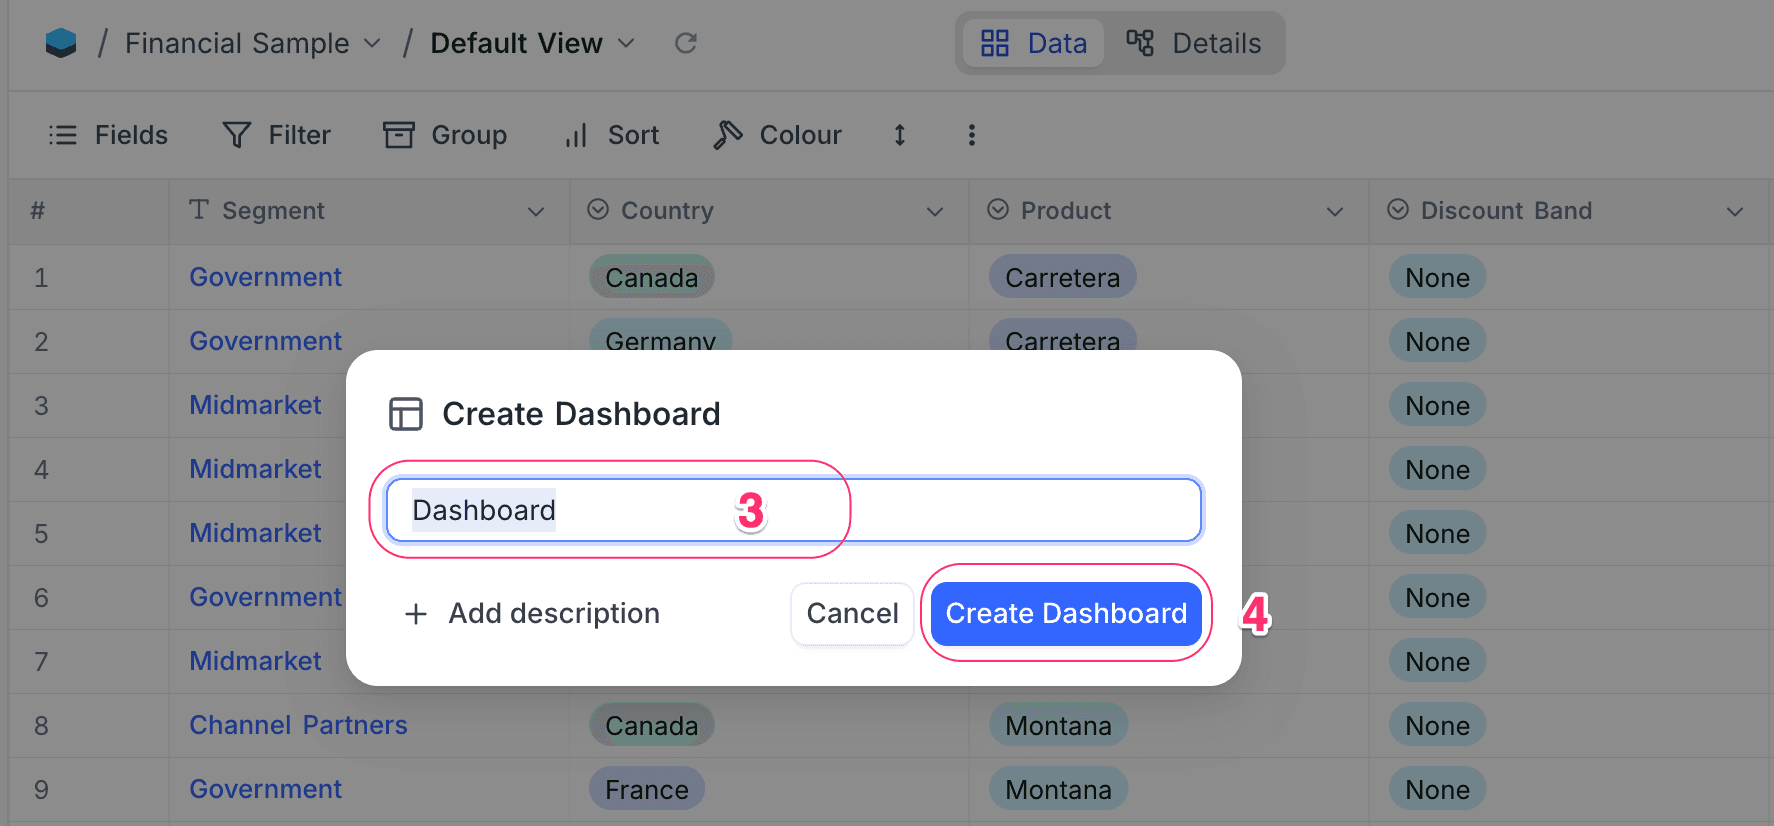
- Enter a name for your dashboard. (Optional, Defaults to "Dashboard")
- Click Create Dashboard to open the dashboard editor.
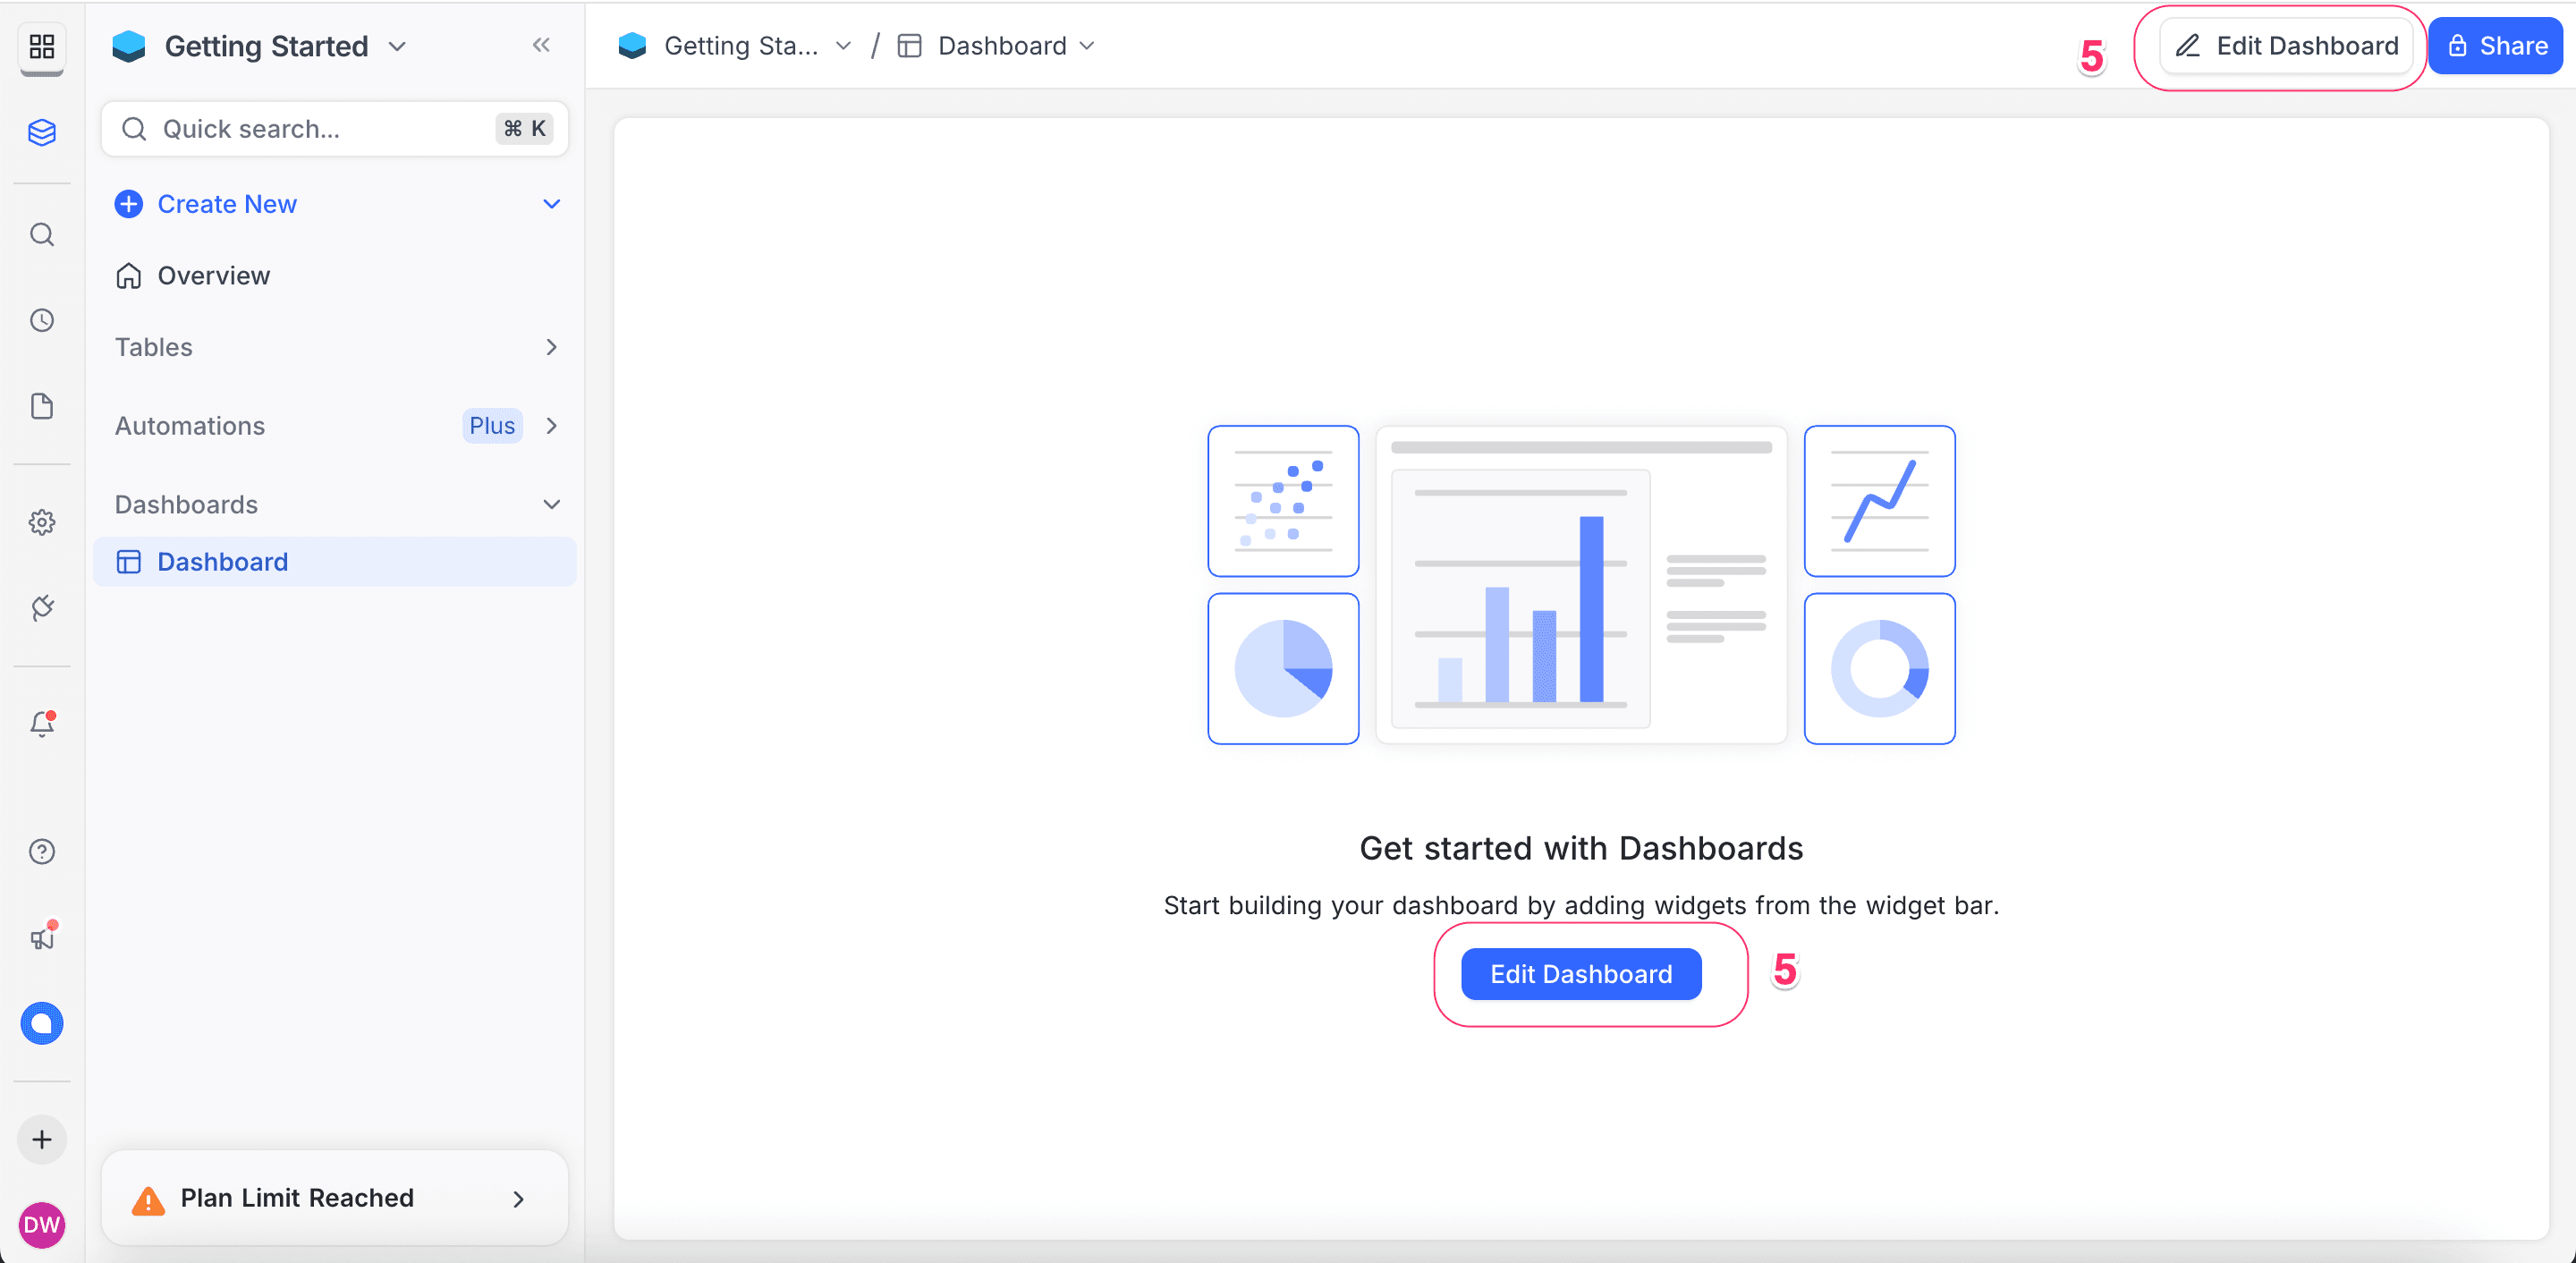
- Click on Edit Dashboard to start adding widgets.
Managing Dashboards
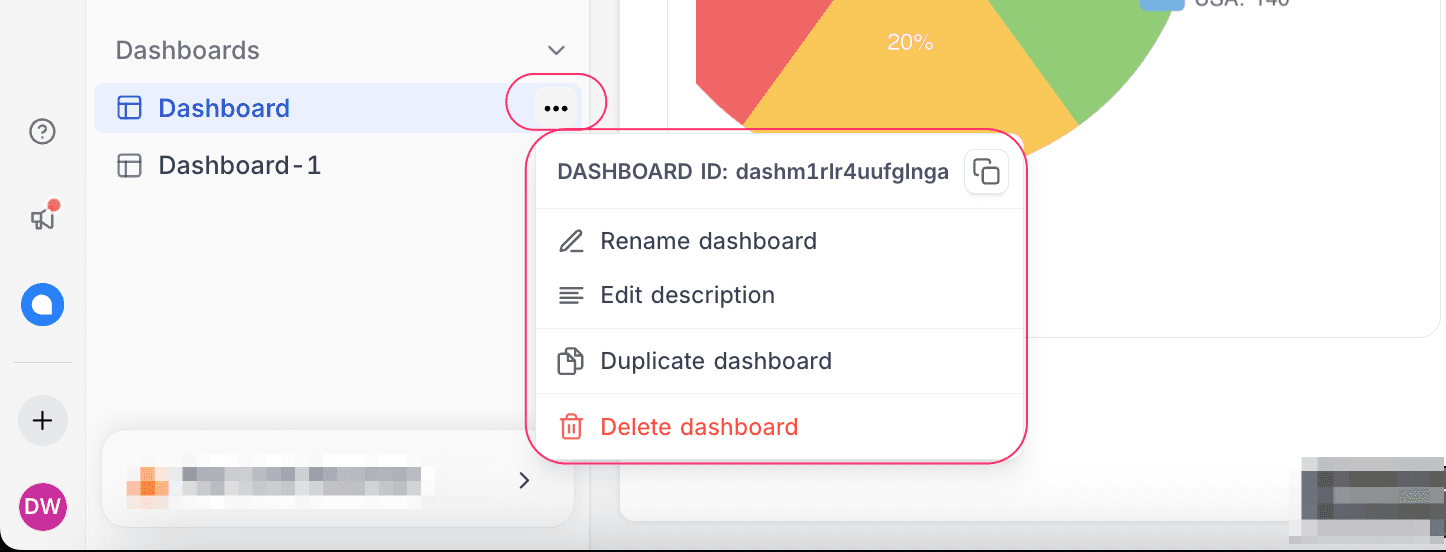
Use the dashboard context menu to perform actions like:
- Rename dashboard: Change the dashboard name
- Edit description: Add or update the dashboard description. This description will appear on hover over the
iicon in the dashboard header. - Duplicate dashboard: Create a copy of the dashboard
- Delete dashboard: Remove the dashboard
Sharing Dashboards
To share a dashboard publicly, click the Share button in the top navigation bar, enable the Enable Public Viewing option, and copy the generated link. Anyone with this link will be able to view the dashboard without requiring a NocoDB account.
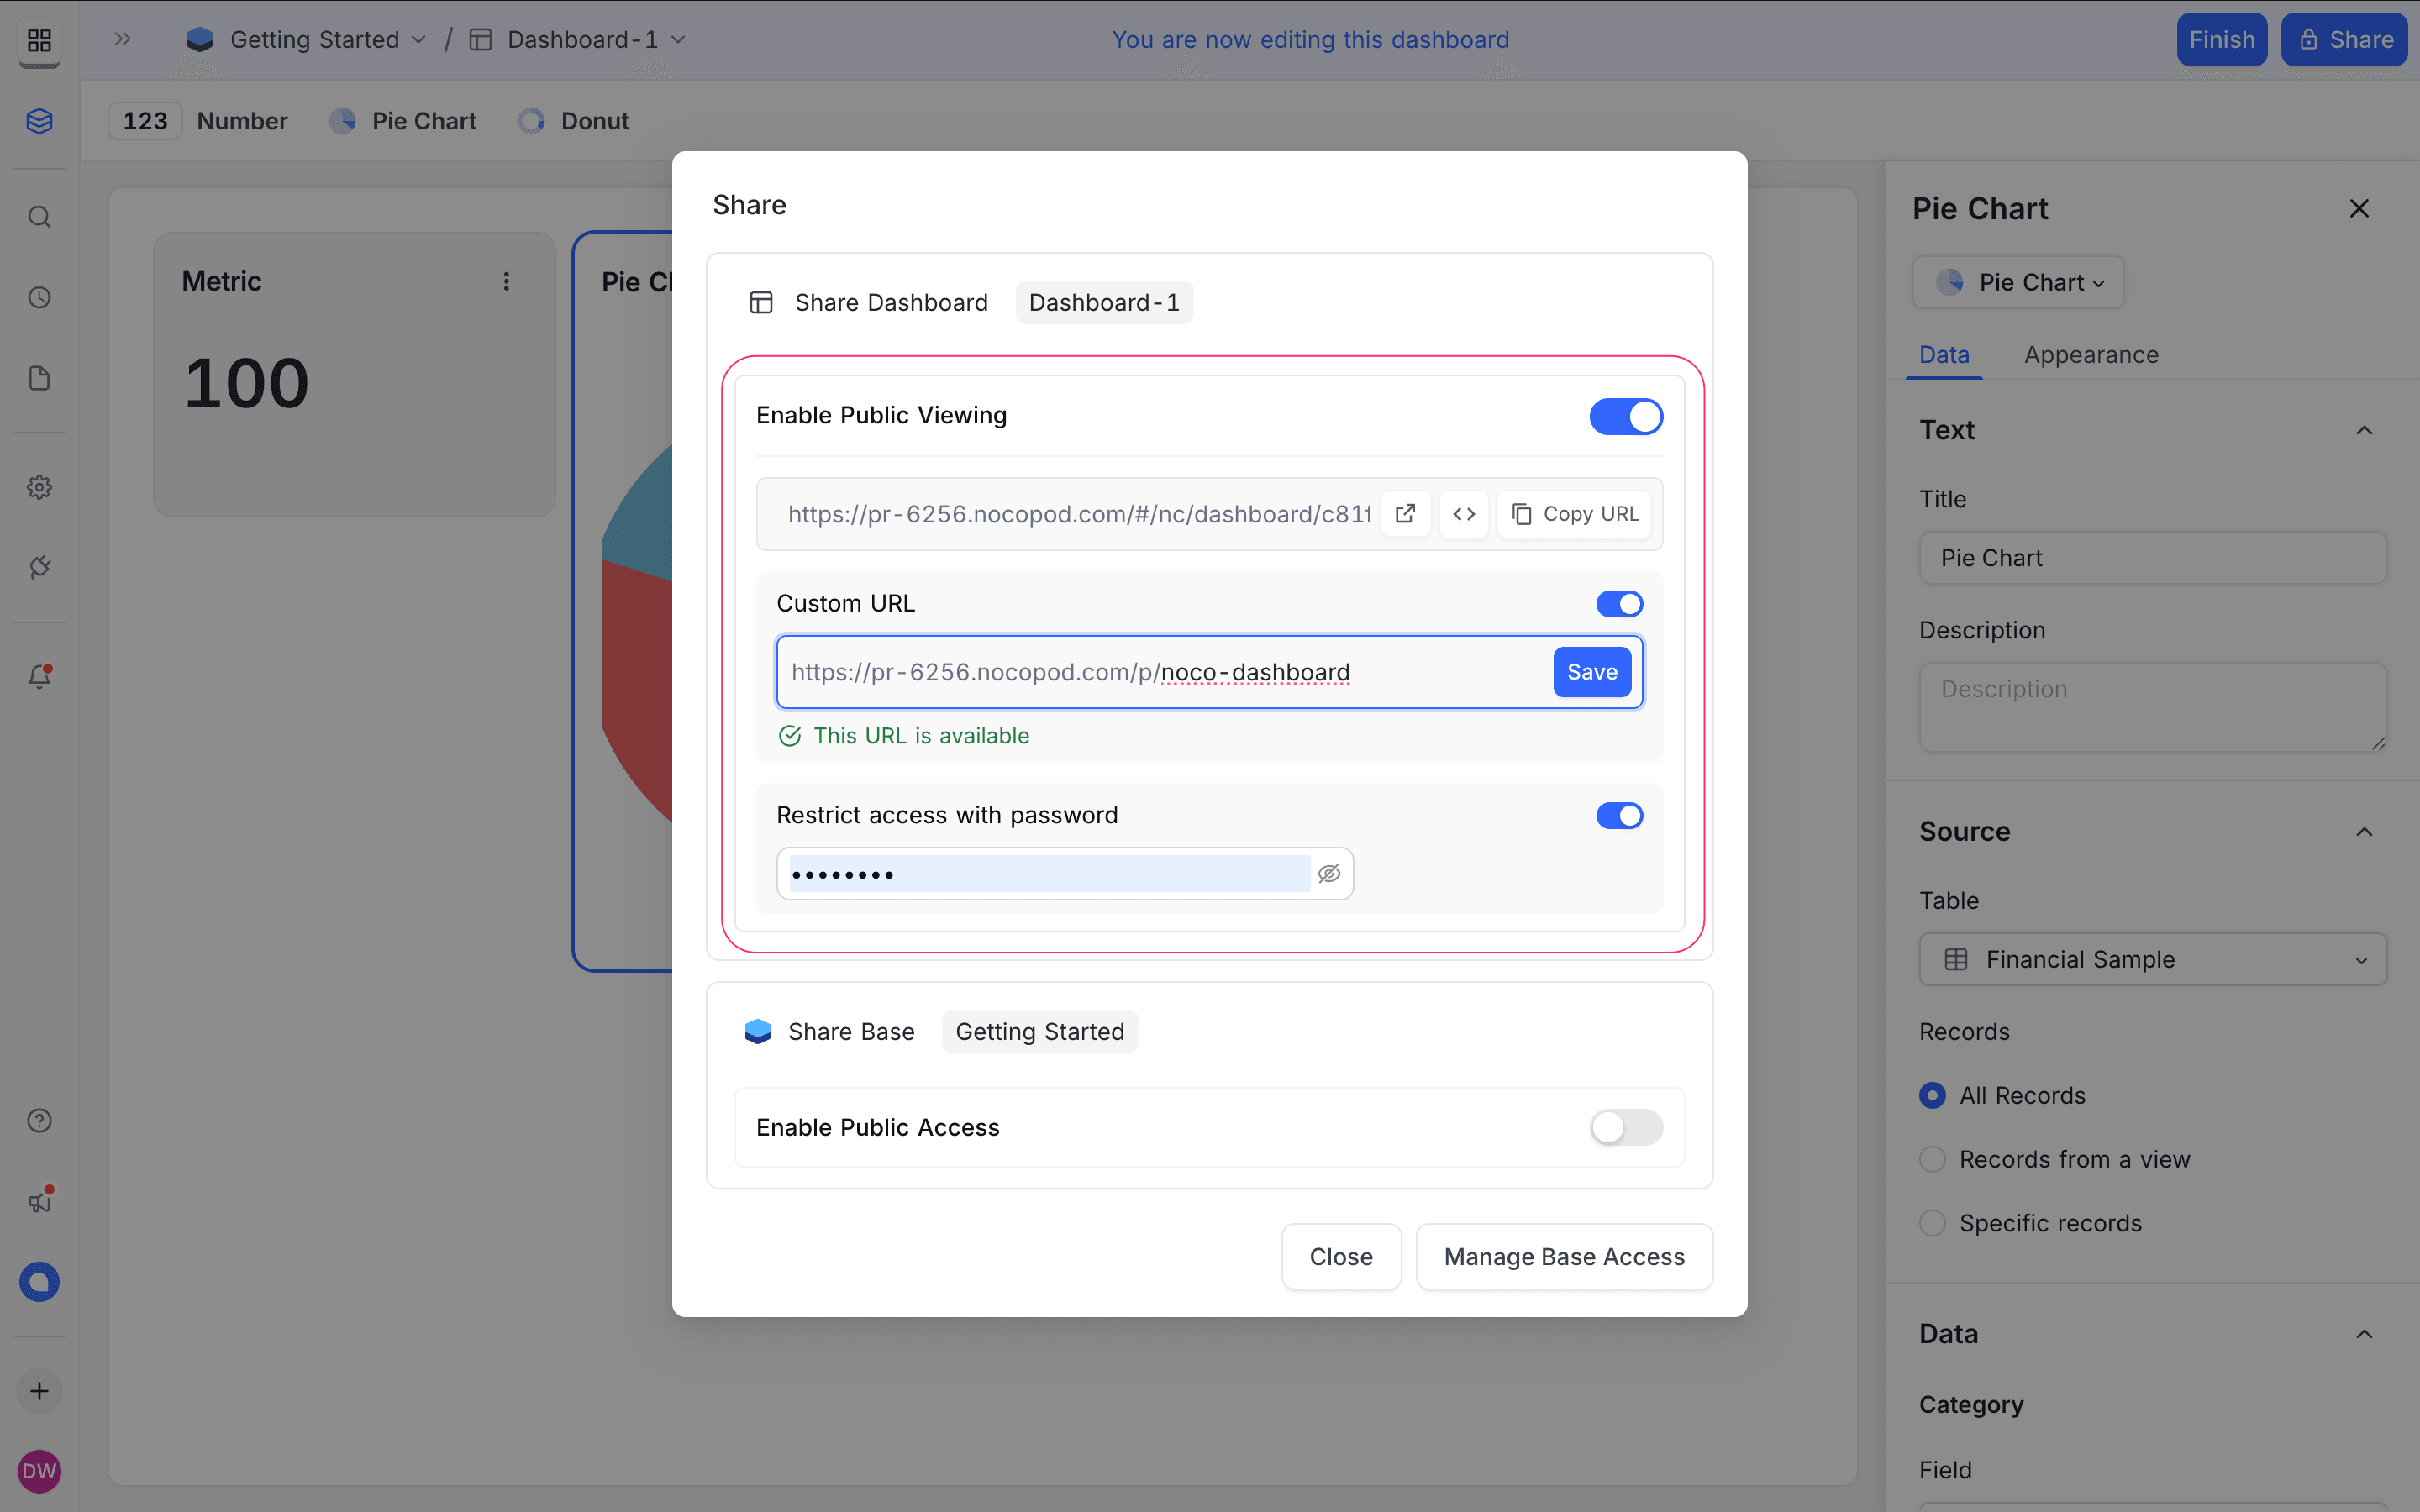
Additional options include:
- Configuring a custom URL for your dashboard.
- Setting a password to control access.
Dashboard sharing works similarly to view sharing. Learn more about sharing views.
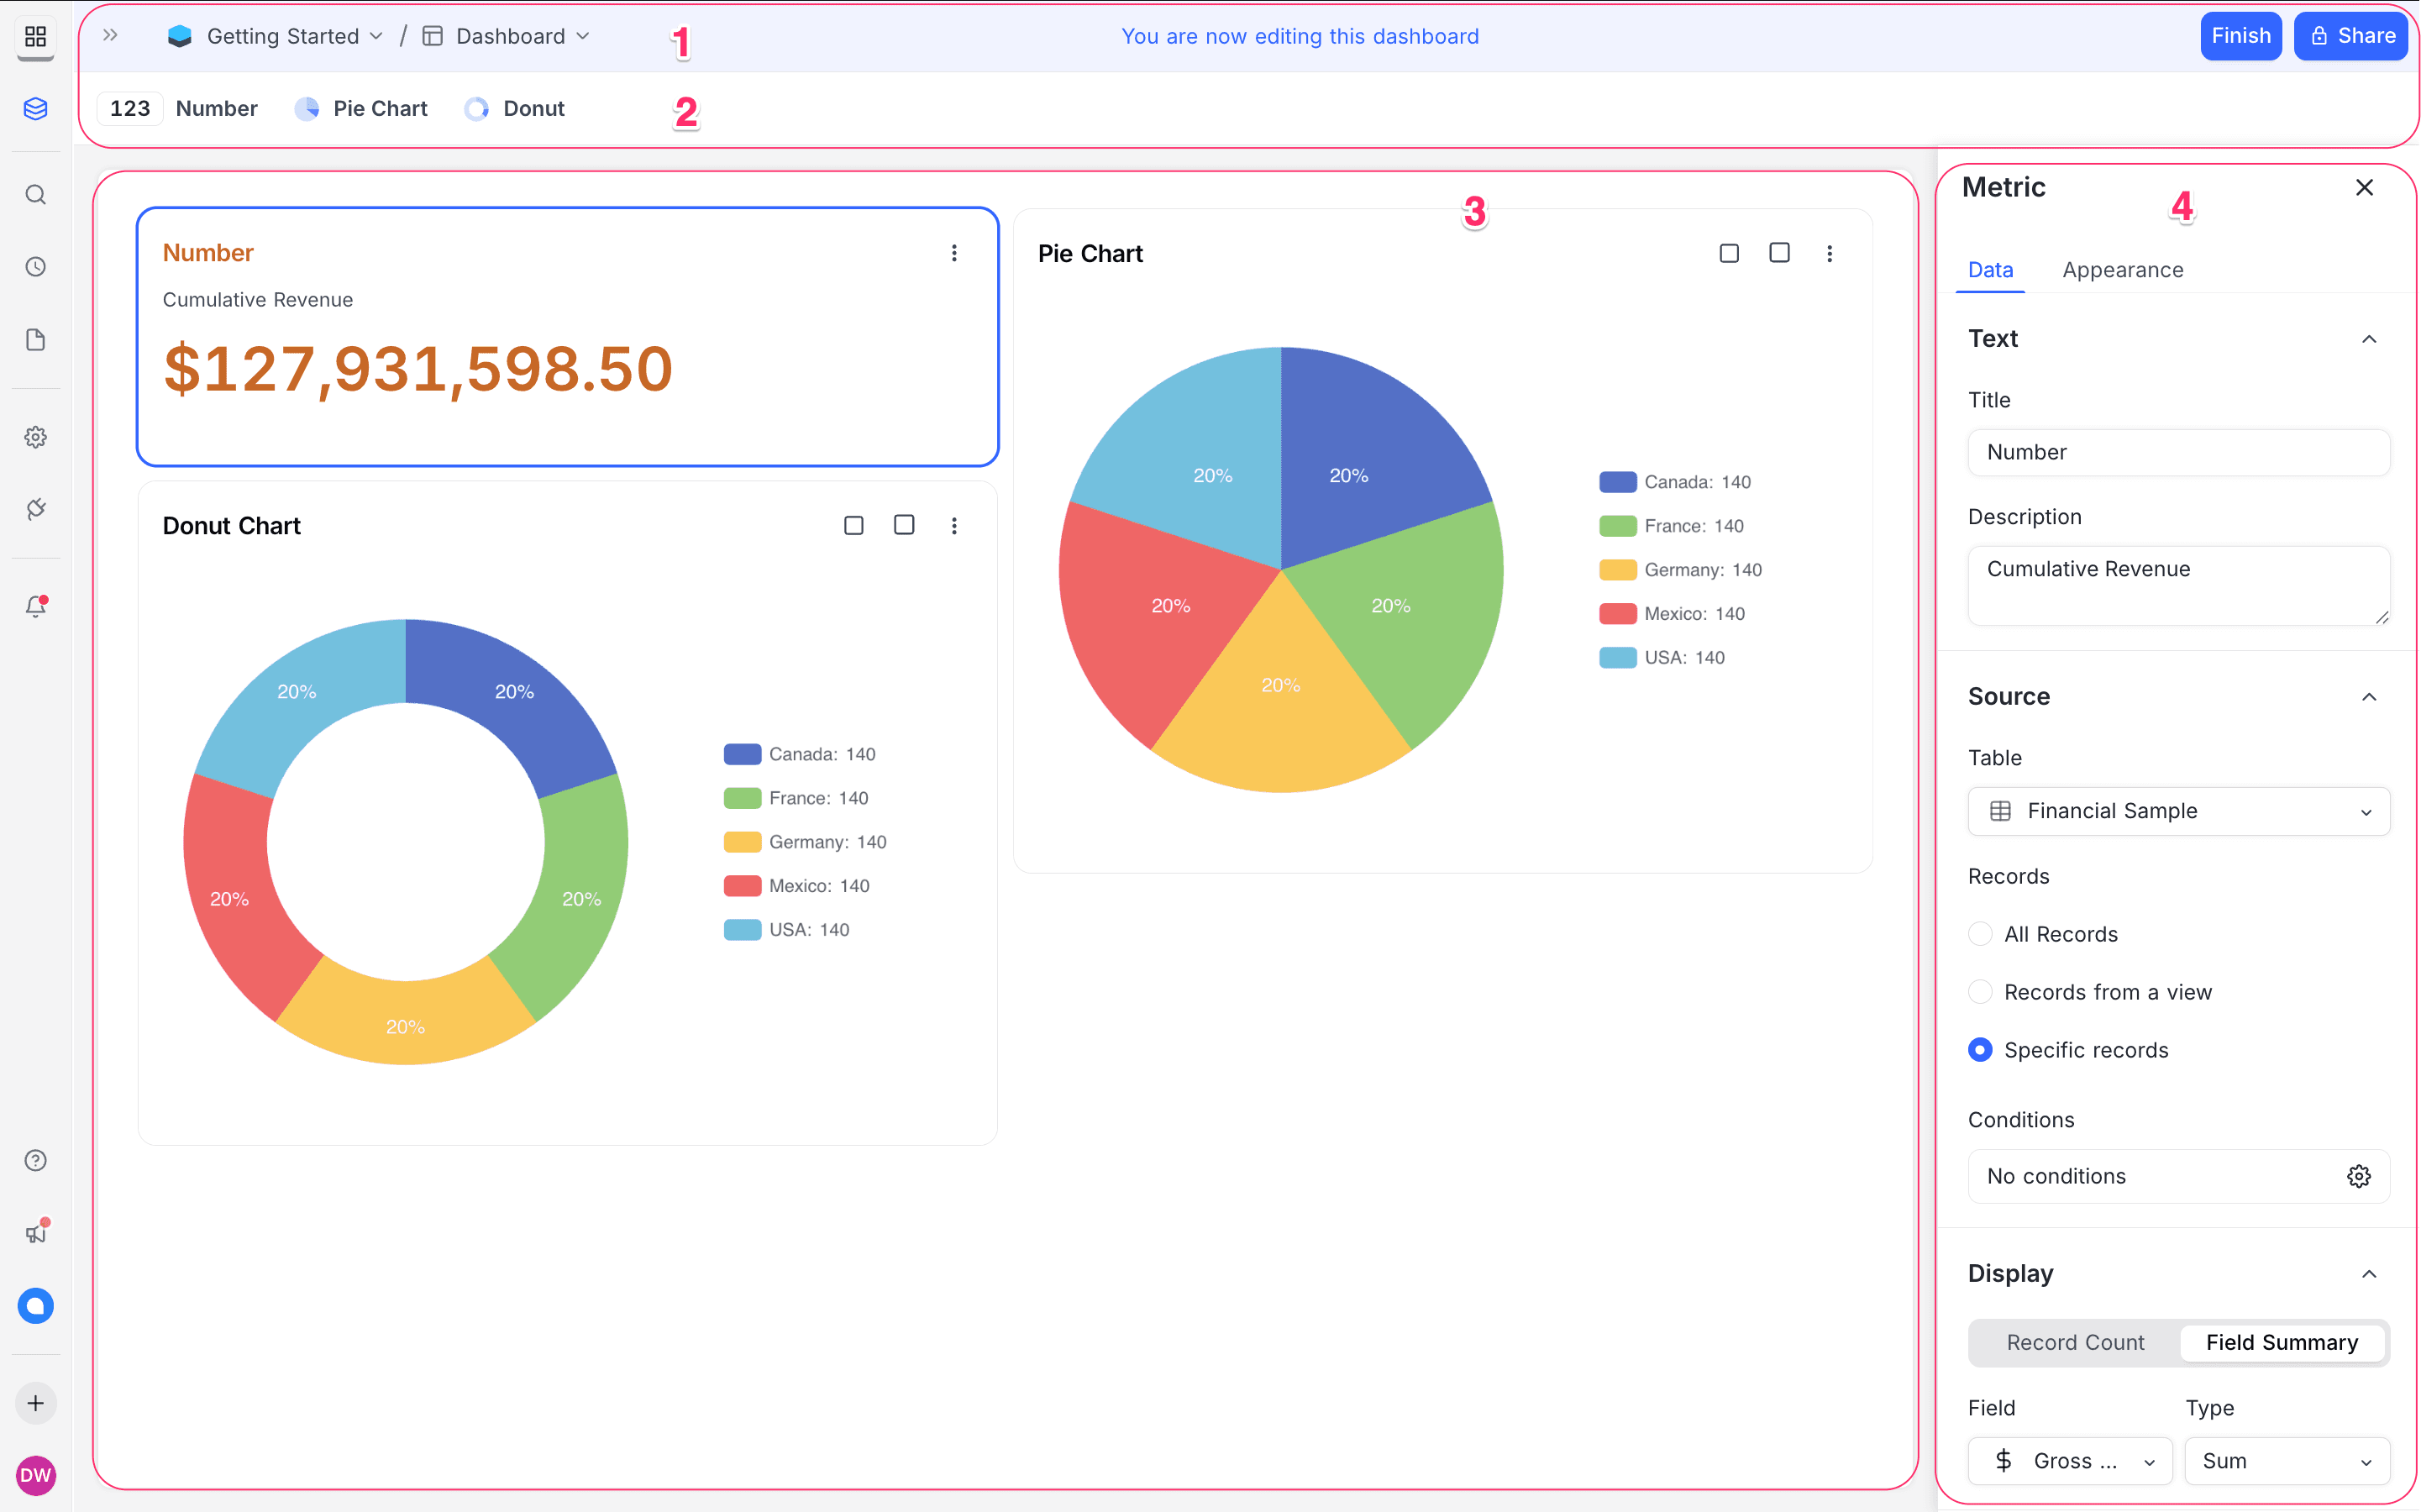
Dashboard Layout
- Top Navigation Bar: Navigation breadcrumbs and dashboard-level actions. Toggle between dashboard View and Edit modes. You can also Share the dashboard with team members.
- Widget Bar: Toolbar at the top with available widget types to add to the dashboard.
- Dashboard Canvas: Main area where widgets are arranged. NocoDB supports a flexible grid layout, allowing you to drag and drop widgets to position them as needed.
- Widget Configuration Panel: Right panel for configuring selected widget properties.
Widgets
NocoDB dashboards support various widget types to visualize data effectively. You can add widgets from the widget bar at the top of the dashboard editor.
The following widget types are available:
| Widget Type | Description |
|---|---|
| Number | Displays KPIs and metric summaries |
| Pie Chart | Visualizes parts of a whole |
| Donut Chart | Pie chart variant with a hollow center |
| Text | Displays static text |
| iFrame | Embeds external web content |
| Bar Chart | Bar chart variant with a hollow center |
| Line Chart | Line chart variant with a hollow center |