Widgets
Add and configure widgets to visualize data in your dashboard
The dashboard editor provides a flexible canvas where you can arrange widgets. You can drag and drop widgets to position them as needed.
NocoDB dashboards support the following widget types:
| Widget Type | Description |
|---|---|
| Number | Displays KPIs and metric summaries |
| Bar Chart | Compares values across categories |
| Line Chart | Shows trends over time |
| Pie Chart | Visualizes parts of a whole |
| Donut Chart | Pie chart variant with a hollow center |
| Text | Displays static information |
| iFrame | Embeds external web content |
Adding Widgets
Click on Edit Dashboard to enter the dashboard editor. Then, use the widget toolbar at the top to add widgets. You can either click on the widget type in the toolbar or drag and drop it onto the dashboard canvas.

Configuring Widgets
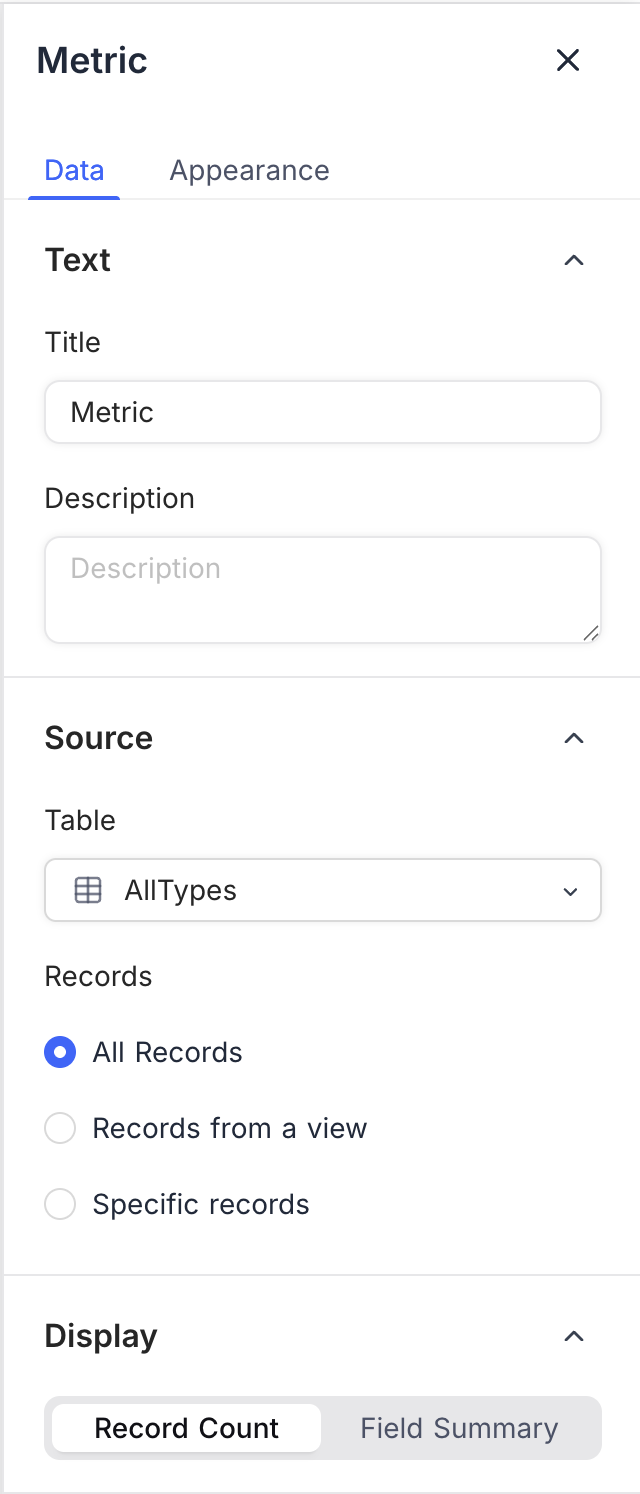
Once a widget is added, you can configure its properties using the right panel. Each widget type has specific configuration options, such as:
- Data Source: Select the table and records to visualize.
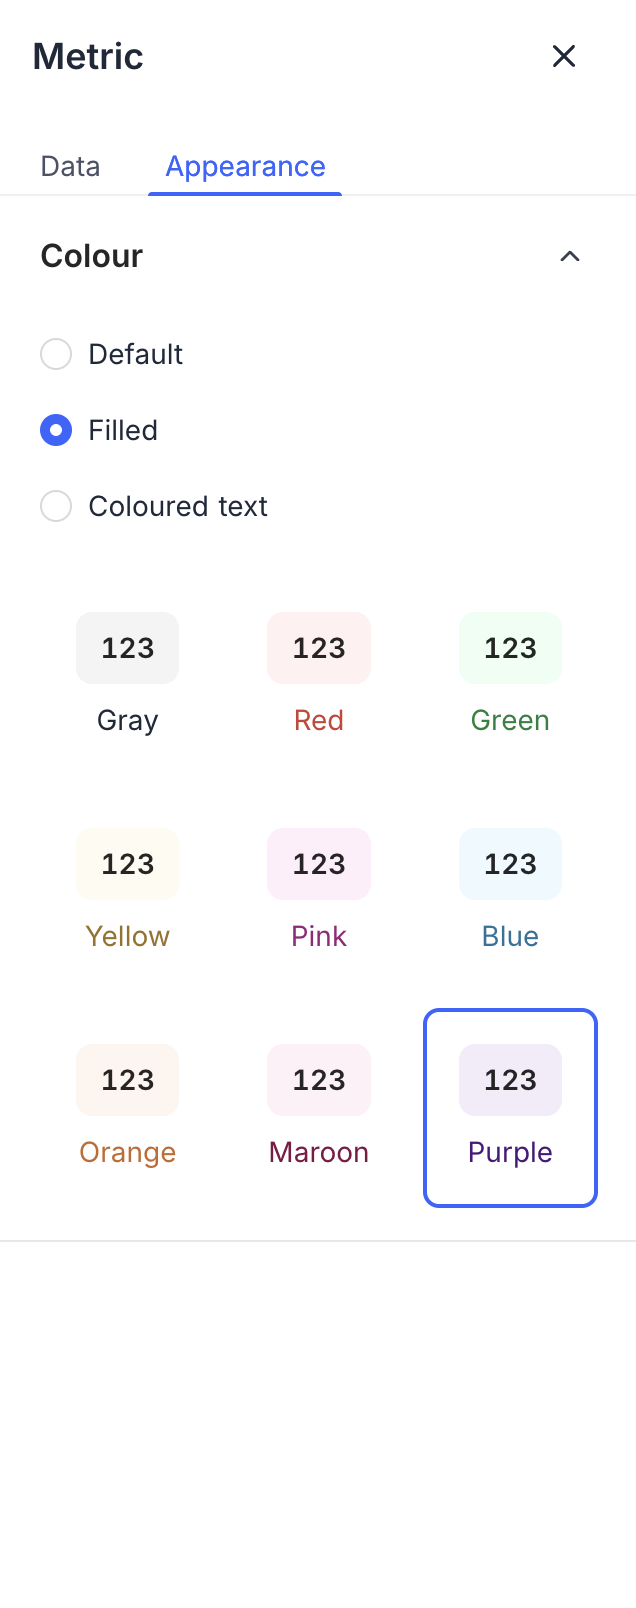
- Display Options: Customize labels, colors, and formatting.
Refer to widget specific notes to learn more about available options for widget configuration.
Arranging Widgets
You can drag and drop widgets to rearrange them on the dashboard canvas. NocoDB supports a flexible grid layout, allowing you to position widgets as needed.

Resizing Widgets
To resize a widget, hover over its right-corner until the resize cursor appears. Click and drag to adjust the widget size. Widget specific restrictions apply. Some widgets can be only resized horizontally.
Deleting Widgets
To remove a widget, click on 3-dot menu in the widget header and select Delete widget.

Duplicating Widgets
To create a copy of a widget, click on the 3-dot menu in the widget header and select Duplicate widget. This is useful for creating similar widgets with minor variations.