Output Methods
Documentation for the output object and its methods in NocoDB Scripts
The output object provides methods for displaying information to users during script execution. These methods allow you to create formatted output in various styles to communicate results, show progress, and present data in a readable format.
Overview
The output methods enable you to:
- Display plain text messages
- Format content with Markdown for better readability
- Present data in formatted tables
- Inspect complex objects in an expandable format
- Clear previous output content
These methods help create a better user experience by providing clear, structured information about what your script is doing and what results it has produced.
Available Methods
output.text(message)
Displays plain text in the output area.
Parameters:
message(string | number | boolean | null): The message to display
Example:
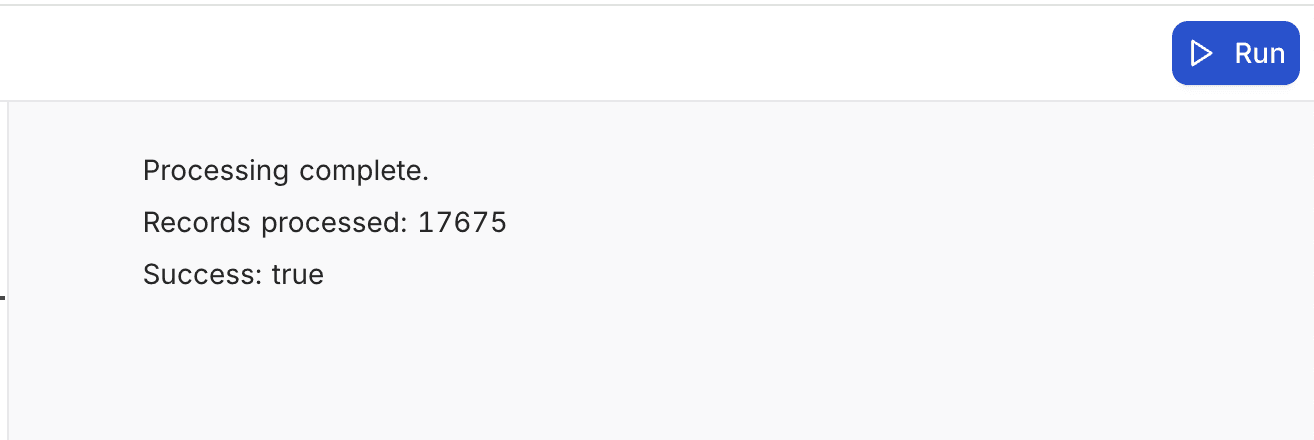
// Basic usage
output.text('Processing complete.');

// Display numbers or other values
output.text(`Records processed: ${recordCount}`);
output.text(`Success: ${isSuccess}`);
Output:
output.markdown()
Renders text with Markdown formatting.
Parameters:
content(string): The Markdown content to render
Example:
// Basic heading and text
output.markdown('# Monthly Sales Report');
output.markdown('Report generated on ' + new Date().toLocaleDateString());
// Lists
output.markdown('## Key Findings\n\n' +
'* Sales increased by 15% compared to last month\n' +
'* Top product: Widget X (1,245 units)\n' +
'* Top region: West (42% of total)');
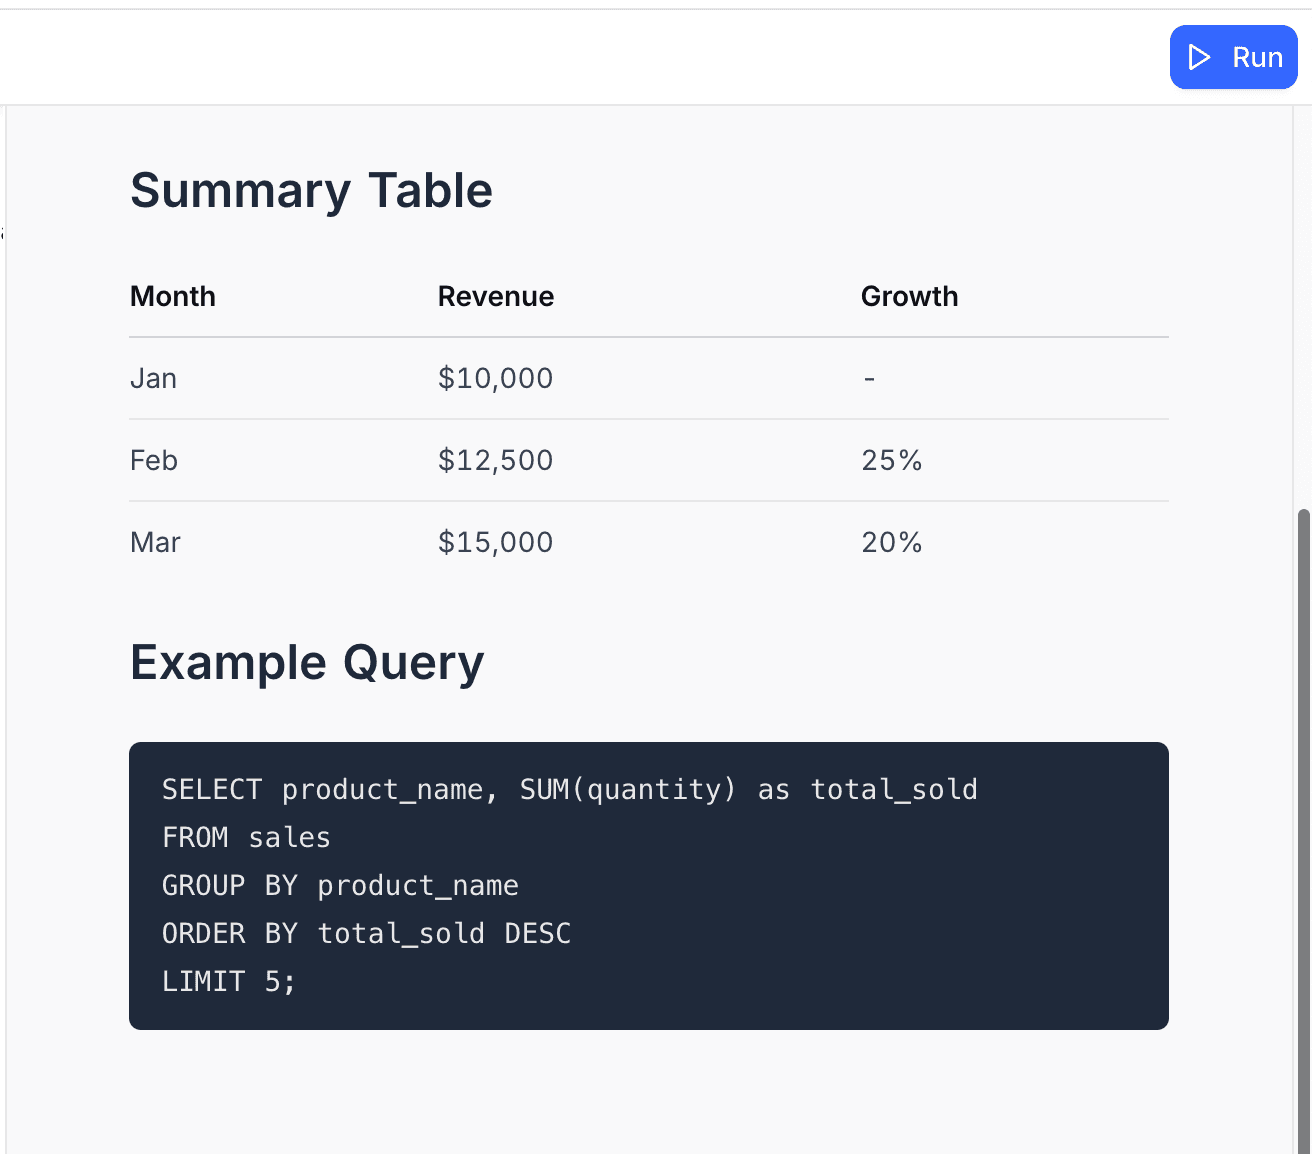
// Tables
output.markdown('## Summary Table\n\n' +
'| Month | Revenue | Growth |\n' +
'|-------|---------|--------|\n' +
'| Jan | $10,000 | - |\n' +
'| Feb | $12,500 | 25% |\n' +
'| Mar | $15,000 | 20% |');
// Code blocks
output.markdown('## Example Query\n\n' +
'```sql\n' +
'SELECT product_name, SUM(quantity) as total_sold\n' +
'FROM sales\n' +
'GROUP BY product_name\n' +
'ORDER BY total_sold DESC\n' +
'LIMIT 5;\n' +
'```');Output:
output.table()
Displays data in a formatted table.
Parameters:
data(Array<object> | object): Array of objects where each object represents a row, or a single object to display
Example:
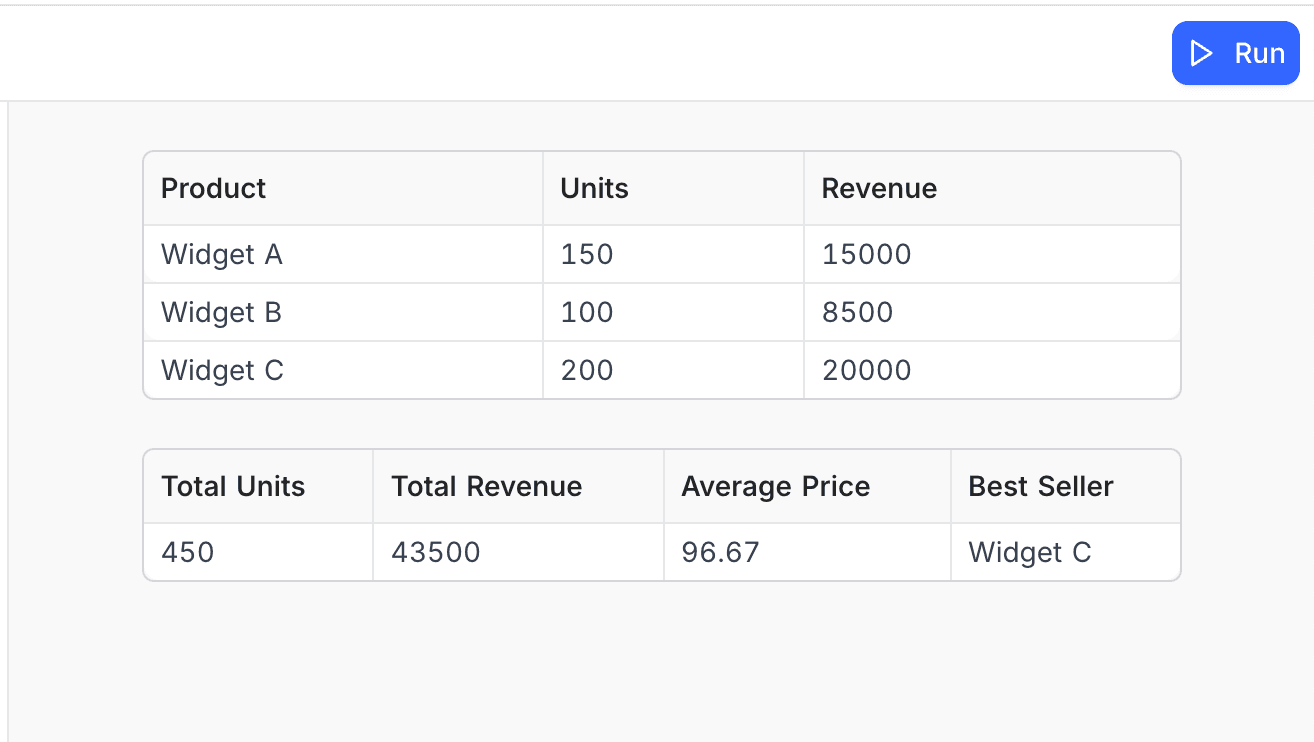
// Display array of objects as table
const salesData = [
  { Product: 'Widget A', Units: 150, Revenue: 15000 },
  { Product: 'Widget B', Units: 100, Revenue: 8500 },
  { Product: 'Widget C', Units: 200, Revenue: 20000 }
];

output.table(salesData);

// Display a single object as a table
const summary = {
  'Total Units': 450,
  'Total Revenue': 43500,
  'Average Price': 96.67,
  'Best Seller': 'Widget C'
};

output.table(summary);
Output:
output.inspect()
Displays an object in an expandable, interactive format for inspection.
Parameters:
data(any): The data to inspect
Example:
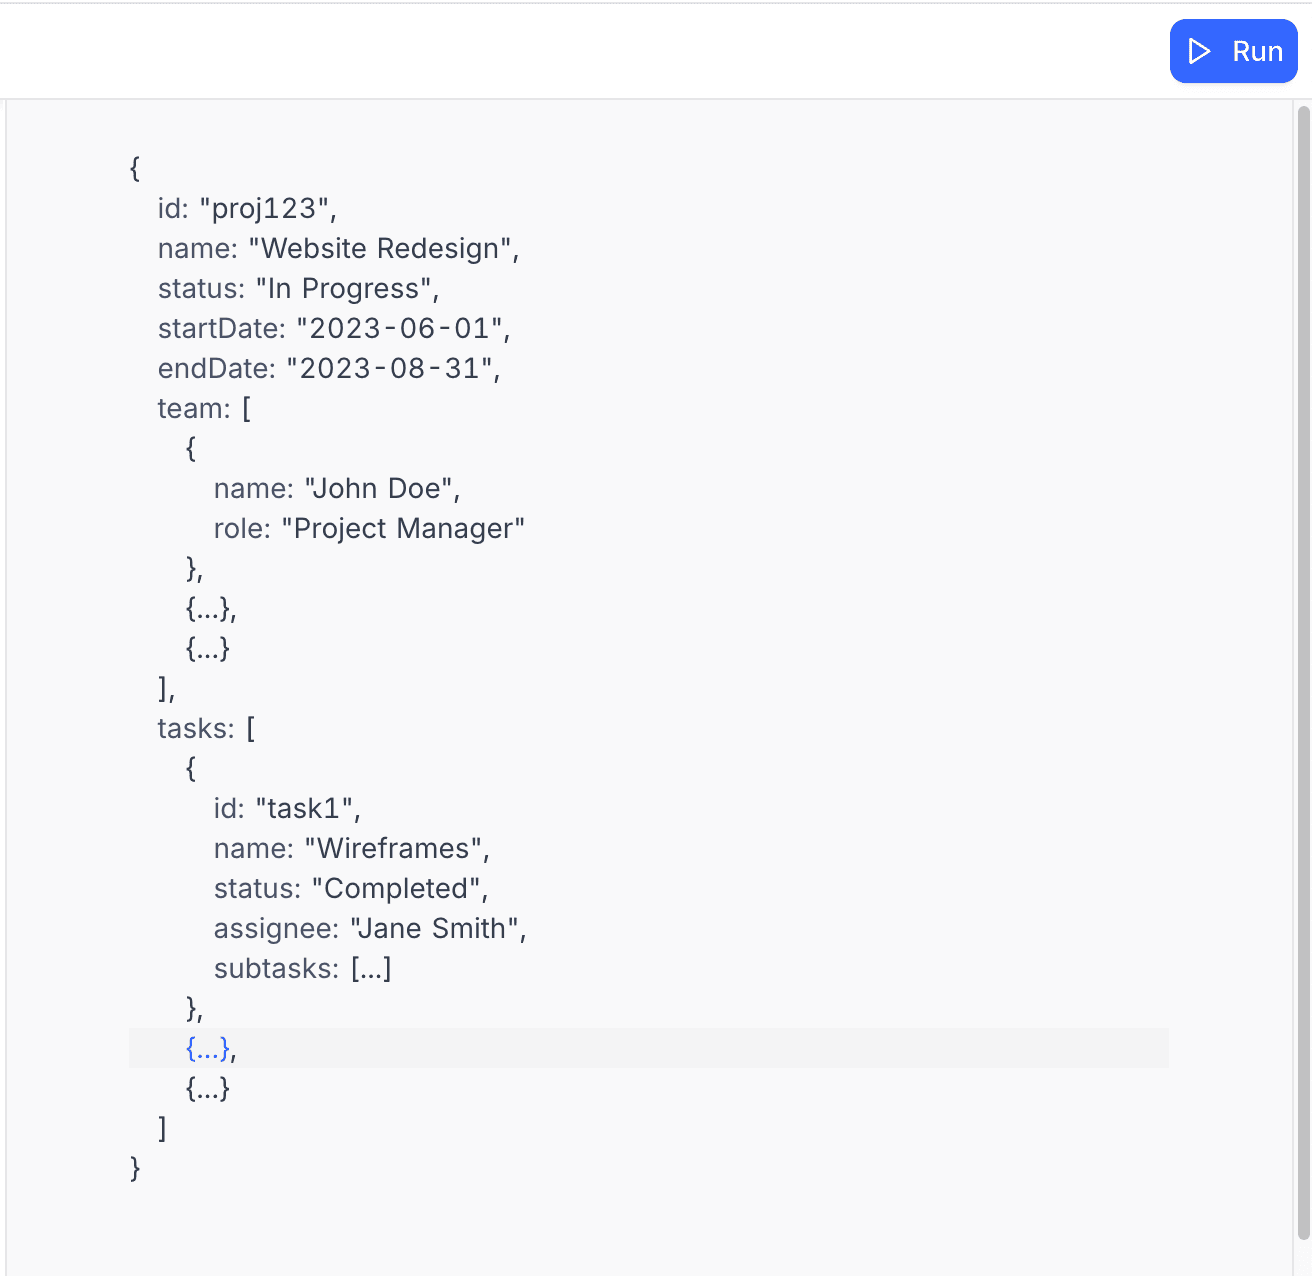
// Inspect a complex object
const projectData = {
  id: 'proj123',
  name: 'Website Redesign',
  status: 'In Progress',
  startDate: '2023-06-01',
  endDate: '2023-08-31',
  team: [
    { name: 'John Doe', role: 'Project Manager' },
    { name: 'Jane Smith', role: 'Designer' },
    { name: 'Bob Johnson', role: 'Developer' }
  ],
  tasks: [
    {
      id: 'task1',
      name: 'Wireframes',
      status: 'Completed',
      assignee: 'Jane Smith',
      subtasks: [
        { name: 'Homepage wireframe', completed: true },
        { name: 'About page wireframe', completed: true },
        { name: 'Contact page wireframe', completed: true }
      ]
    },
    {
      id: 'task2',
      name: 'Design',
      status: 'In Progress',
      assignee: 'Jane Smith',
      subtasks: [
        { name: 'Homepage design', completed: true },
        { name: 'About page design', completed: false },
        { name: 'Contact page design', completed: false }
      ]
    },
    {
      id: 'task3',
      name: 'Development',
      status: 'Not Started',
      assignee: 'Bob Johnson',
      subtasks: [
        { name: 'Frontend setup', completed: false },
        { name: 'Homepage implementation', completed: false },
        { name: 'Testing', completed: false }
      ]
    }
  ]
};

output.inspect(projectData);
Output:
output.clear()
Clears all previous output content.
Example:
// Clear previous output before showing new results
output.clear();
output.markdown('# New Results');
output.text('Previous output has been cleared.');
Practical Examples
Creating a Structured Report
// Structured report with sections and formatting
async function generateSalesReport() {
  // Get the Sales table
  const salesTable = base.getTable('Sales');

  // Query sales data
  const salesData = await salesTable.selectRecordsAsync({
    fields: ['Date', 'Product', 'Quantity', 'Unit Price', 'Total', 'Region']
  });

  // Clear any previous output
  output.clear();

  // Report header
  output.markdown('# Monthly Sales Report');
  output.markdown(`Generated on: ${new Date().toLocaleDateString()}`);
  output.markdown(`Data period: ${getLastMonthRange()}`);

  // Summary metrics
  const totalSales = calculateTotalSales(salesData.records);
  const totalUnits = calculateTotalUnits(salesData.records);
  const averageOrderValue = totalSales / salesData.records.length;

  output.markdown('## Summary Metrics');

  const summaryData = {
    'Total Sales': `$${totalSales.toLocaleString()}`,
    'Total Units Sold': totalUnits.toLocaleString(),
    'Number of Orders': salesData.records.length.toLocaleString(),
    'Average Order Value': `$${averageOrderValue.toFixed(2)}`,
    'Average Units per Order': (totalUnits / salesData.records.length).toFixed(1)
  };

  output.table(summaryData);

  // Products breakdown
  output.markdown('## Product Performance');

  const productData = getProductBreakdown(salesData.records);
  output.table(productData);

  // Regional breakdown
  output.markdown('## Regional Performance');

  const regionData = getRegionalBreakdown(salesData.records);
  output.table(regionData);


  // Daily trend
  output.markdown('## Daily Sales Trend');
  output.text('Daily sales for the past month:');

  const dailyData = getDailySales(salesData.records);
  output.table(dailyData);

  // Helper functions
  function getLastMonthRange() {
    const today = new Date();
    const lastMonth = new Date(today);
    lastMonth.setMonth(lastMonth.getMonth() - 1);

    return `${lastMonth.toLocaleDateString()} - ${today.toLocaleDateString()}`;
  }

  function calculateTotalSales(records) {
    return records.reduce((sum, record) => {
      return sum + (record.getCellValue('Total') || 0);
    }, 0);
  }

  function calculateTotalUnits(records) {
    return records.reduce((sum, record) => {
      return sum + (record.getCellValue('Quantity') || 0);
    }, 0);
  }

  function getProductBreakdown(records) {
    const productMap = {};

    for (const record of records) {
      const product = record.getCellValue('Product');
      const quantity = record.getCellValue('Quantity') || 0;
      const total = record.getCellValue('Total') || 0;

      if (!product) continue;

      if (!productMap[product]) {
        productMap[product] = {
          units: 0,
          sales: 0
        };
      }

      productMap[product].units += quantity;
      productMap[product].sales += total;
    }

    // Convert to array for table display
    return Object.entries(productMap).map(([product, data]) => ({
      'Product': product,
      'Units Sold': data.units,
      'Revenue': `$${data.sales.toLocaleString()}`,
      'Average Price': `$${(data.sales / data.units).toFixed(2)}`
    }));
  }

  function getRegionalBreakdown(records) {
    const regionMap = {};

    for (const record of records) {
      const region = record.getCellValue('Region') || 'Unknown';
      const total = record.getCellValue('Total') || 0;

      if (!regionMap[region]) {
        regionMap[region] = 0;
      }

      regionMap[region] += total;
    }

    // Calculate total for percentages
    const grandTotal = Object.values(regionMap).reduce((sum, val) => sum + val, 0);

    // Convert to array for table display
    return Object.entries(regionMap).map(([region, sales]) => ({
      'Region': region,
      'Revenue': `$${sales.toLocaleString()}`,
      'Percentage': `${((sales / grandTotal) * 100).toFixed(1)}%`
    }));
  }

  function getDailySales(records) {
    const dailyMap = {};

    for (const record of records) {
      const dateValue = record.getCellValue('Date');
      if (!dateValue) continue;

      const date = new Date(dateValue);
      const dateString = date.toISOString().split('T')[0]; // YYYY-MM-DD
      const total = record.getCellValue('Total') || 0;

      if (!dailyMap[dateString]) {
        dailyMap[dateString] = 0;
      }

      dailyMap[dateString] += total;
    }

    // Convert to array and sort by date
    return Object.entries(dailyMap)
      .map(([date, sales]) => ({
        'Date': new Date(date).toLocaleDateString(),
        'Sales': `$${sales.toLocaleString()}`
      }))
      .sort((a, b) => new Date(a.Date) - new Date(b.Date));
  }
}

// Run the report
await generateSalesReport();
Best Practices
-
Use clear headings - Organize your output with markdown headings to create a logical structure that's easy to scan.
-
Include timestamps - Add timestamps to long-running processes so users know when actions occurred.
-
Use the right output type - Choose the appropriate output method for your content:
text()for simple messagesmarkdown()for formatted content with headers and liststable()for tabular datainspect()for complex nested objects
-
Show progress updates - For long-running operations, provide regular progress updates so users know the script is still working.
-
Provide summary information - Include summary metrics and totals to give users a quick overview of results.
-
Format numbers and dates - Use
toLocaleString(),toFixed(), and other formatting methods to make numbers and dates more readable. -
Use visual elements - Employ markdown features like lists, tables, and code blocks to enhance readability.
-
Keep error messages informative - Provide clear, actionable error messages that help users understand what went wrong and how to fix it.